Pivot points are one of the most popular indicators used in technical analysis. They are mathematically calculated using the high, low and closing prices of the previous day for daily pivots, previous week for weekly pivots and so on. The resulting price levels provide you with significant points of support or resistance that can be be used for good reversal or continuation setups as well as stop loss positioning and profit targets. They are well respected due to the fact that a lot of traders look at them and make use of them in their daily trading.
The Make-up of Pivot Points
Daily pivots are made up of a central pivot as well as other levels of support and resistance, and can be calculated for a daily, weekly or monthly time period.
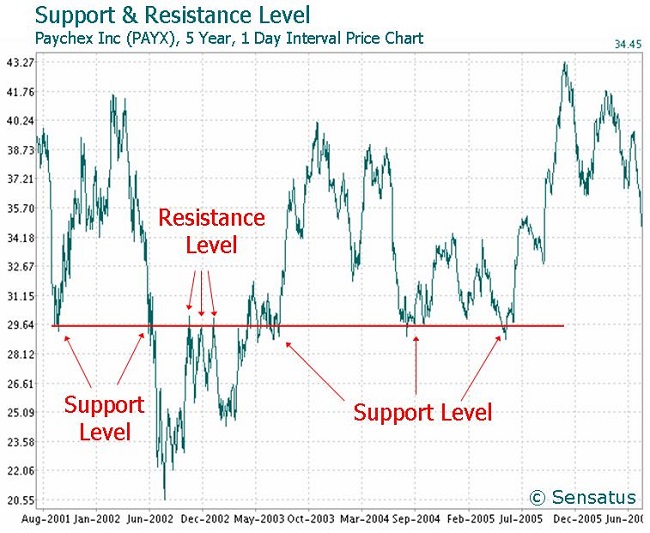
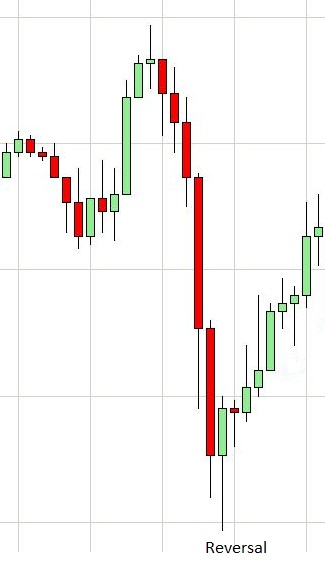
Resistance points as well as the central pivot represent levels where in an uptrend, price increases may become unsustainable and a reversal could occur. The central pivot and support levels represent areas at which a slide in prices runs out of selling momentum and could potentially recover.
Article Source: http://EzineArticles.com/7170800


